
Inflation last month returned again to double digits, the latest figures show, hitting 10.1%. Soaring prices for food and drink were the biggest driver behind the increase, with an annual rise of almost 15%, the fastest annual jump for more than 42 years.
The Office for National Statistics compiled the overall figure using the consumer prices index but also logs the increasing prices of individual goods and services. Here we break down how those everyday items have shot up over the past year.
In each case, the figure is the percentage change in the average price over the 12 months to September 2022, and on many occasions the rate has risen to an even higher level than in August.
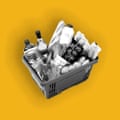
Food and drink
 View image in fullscreen
Food
Low-fat milk 42.1%
Butter 28.0%
Pasta and couscous 22.7%
Olive oil 27.2%
Margarine and other vegetable fats 30.5%
Jams, marmalades and honey 28.1%
Sauces, condiments, salt, spices and culinary herbs 22.1%
Cheese and curd 23.1%
Ready-made meals 19.0%
Potatoes 19.9%
Eggs 22.3%
Yoghurt 12.8%
Pork 14.6%
Edible ices and ice-cream 11.5%
Fish 13.5%
Bread 14.6%
Pizza and quiche 9.7%
Fruit 8.8%
Rice 6.8%
Sugar 4.7%
Drinks
Mineral or spring waters 21.3%
Fruit and vegetable juices 14%
Coffee 15.4%
Tea 12.1%
Soft drinks 9%
Beer 3.9%
Spirits 2.4%
Wine 2.6%
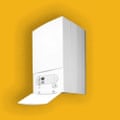
Electricity, gas and other fuels
 View image in fullscreen
Liquid fuels 102.2%
Gas 102.2%
Electricity 54.0%
Solid fuels 31.7%
Clothing and shoes
 View image in fullscreen
Garments for infants and children 6.9%
Footwear for infants and children 11.5%
Garments for women 8.6%
Footwear for women 7.1%
Garments for men 10.4%
Footwear for men 3.2%
Clothing accessories 7.1%
Household items and furniture
 View image in fullscreen
Garden furniture 14.2%
Heaters and air conditioners 21.6%
Irons 10.6%
Refrigerators, freezers and fridge-freezers 14.3%
Glassware and chinaware 12.2%
Cookers 10.8%
Bed linen 6%
Lighting equipment 7.6%
Carpets and rugs 5.8%
Vehicles and passenger transport
 View image in fullscreen
Secondhand cars 2.4%
New cars 6.9%
Bicycles 6.0%
Motorcycles 2.2%
By air 35.7%
By train 9%
By underground and tram 5.1%
By bus and coach 8.8%
By sea and inland waterway 0.3%
Hospitality and recreation
 View image in fullscreen
Hotels and motels 16.6%
Holiday centres, campsites and youth hostels 13.2%
Cinemas, theatres and concerts 4.2%
Museums, libraries and zoos 5%
Fast food and takeaway food services 11.5%
Restaurants and cafes 8.2%
Canteens 7.6%
Other recreational items
 View image in fullscreen
Garden products 14.7%
Products for pets 18.5%
Sport equipment 12%
Veterinary and other services for pets 10.5%
Equipment for sport 12%
Plants and flowers 9.8%

